GUI#
The GUI is structured in four main sections fig:
The top progress bar
The right settings panel
The central viewer panel
The left mode panel
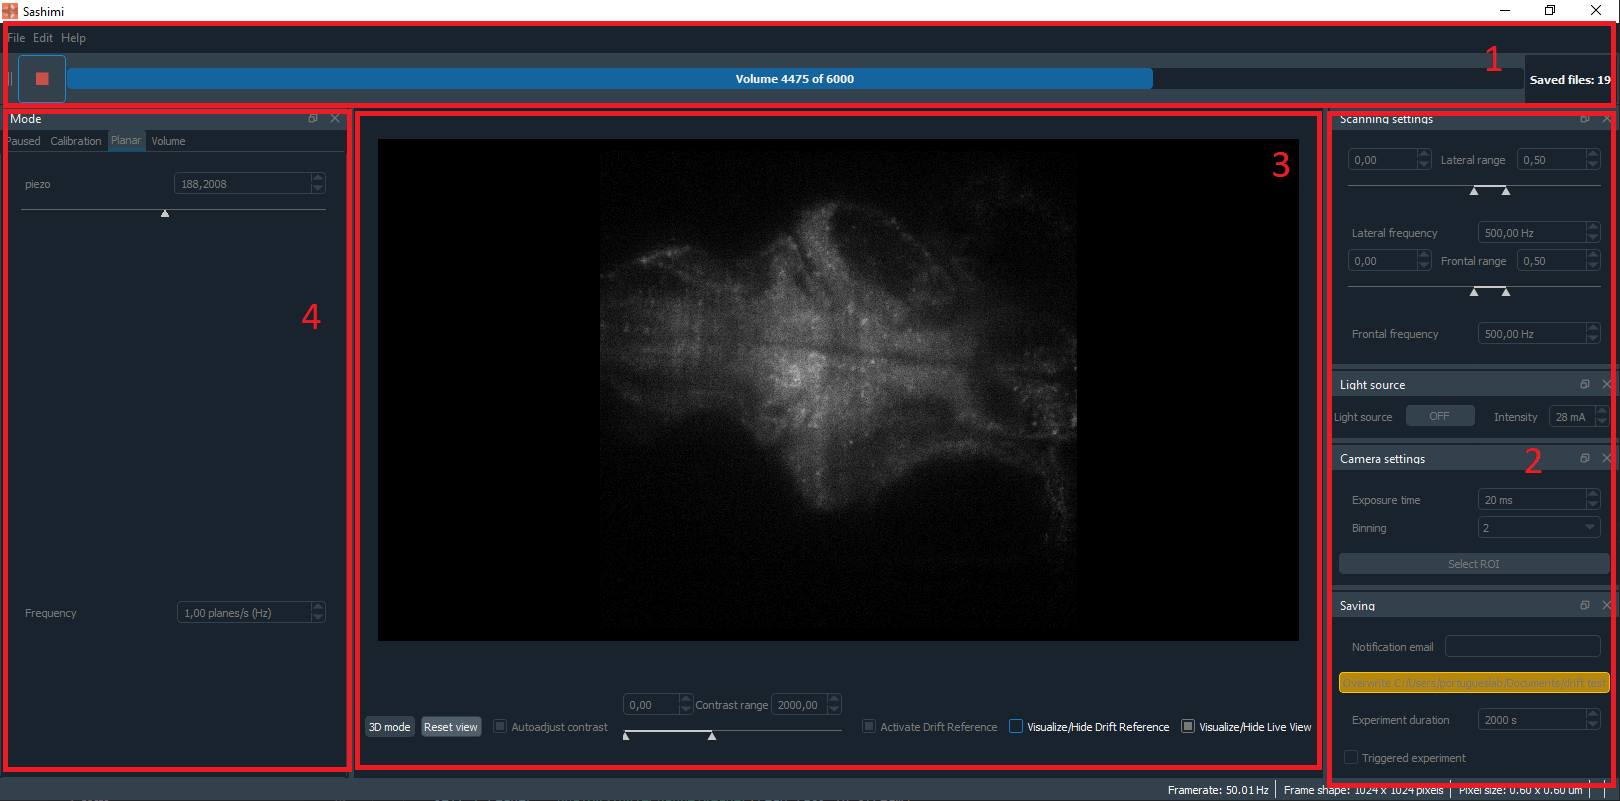
Fig. 2 Sashimi GUI#
Progress Bar#
The progress bar (see fig box 1) has two important functions, firstly it displays to the user the number of volumes acquired and how many are left, giving feedback on the progress of the acquisition.
Secondly, it gets the user input for the start, stop, and pause of the experiment. When the button to start the experiment is pressed the GUI interface communicates with the main process (State class) and signals to start the experiment routine. During the experiment, the GUI pings the state to get the saving status (available in the state class through the saving process) and updates the feedback progress bar.
Settings Panel#
The right settings panel is a column that hosts four settings widgets (see fig box 2). These are all instantiated as children of a standardized widget factory called lightparam [6] and are defined inside the main process which sends each input value to their relative processes. The upper widget is for the scanning settings and allows for modification of the frontal and lateral horizontal galvos frequency and range (see fig).
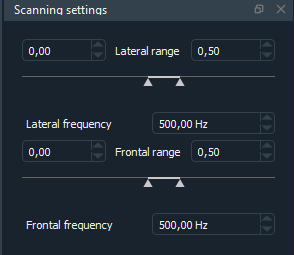
Fig. 3 Scanning settings#
Below it, there are the light source settings that allow the user to turn the laser on/off and adjust the laser power (see fig). The third from the top adjusts the camera settings, in particular, the exposure time (in ms), the binning, and allows the user to select a region of interest (ROI) to narrow down the recorded frame view(see fig).
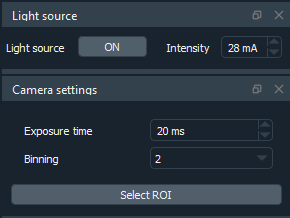
Fig. 4 Camera and light source settings#
Finally, the bottom widget hosts the saving settings (see fig), where the user can set:
The duration of the experiment (only if it is a non-triggered experiment, otherwise the behavioral protocol duration will be used).
The saving folder.
Whether it is a triggered experiment or not.
And an email to receive a notification when the acquisition is over.
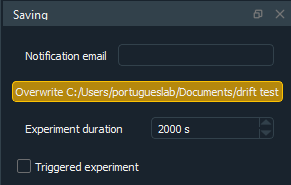
Fig. 5 Saving settings#
Viewer Panel#
The viewer panel is the main panel in the program, it is a Napari viewer with additional custom functionality (see fig section 3). It is used by the program to display the live view from the camera, both in 2D and 3D, and has several settings at the bottom:
A button to toggle the 3D mode view on/off.
A button to reset the view.
A slider to manually adjust the contrast.
A button to automatically adjust the contrast.
Three more buttons control the saving and visualization of the first volume acquired, which can be used to check the drift of the specimen (see figure).
One button activates the saving of a reference volume (if the button is set, then the first volume of the acquisition is saved in a layer).
Two buttons to hide/view either the reference layer or the live view from the camera (this allows the user to overlay the two, but also to inspect each layer independently).
All of the manipulations done inside the viewer will not be saved in the acquired data and serve the sole purpose of allowing the user to visualize and inspect the data in a real-time manner. These different functionalities are handled by two different widgets:
The viewer widget, generates the layers, refreshes the images, resets and updates the contrast values, and controls the reference layer for the drift.
The camera widget, which checks the region of interest dimensions, corrects them in case they point beyond the maximum frame size, and sends them to the main process, which will relay them to the camera process. Additionally, it resets, hides, and visualizes the region of interest (ROI) section.
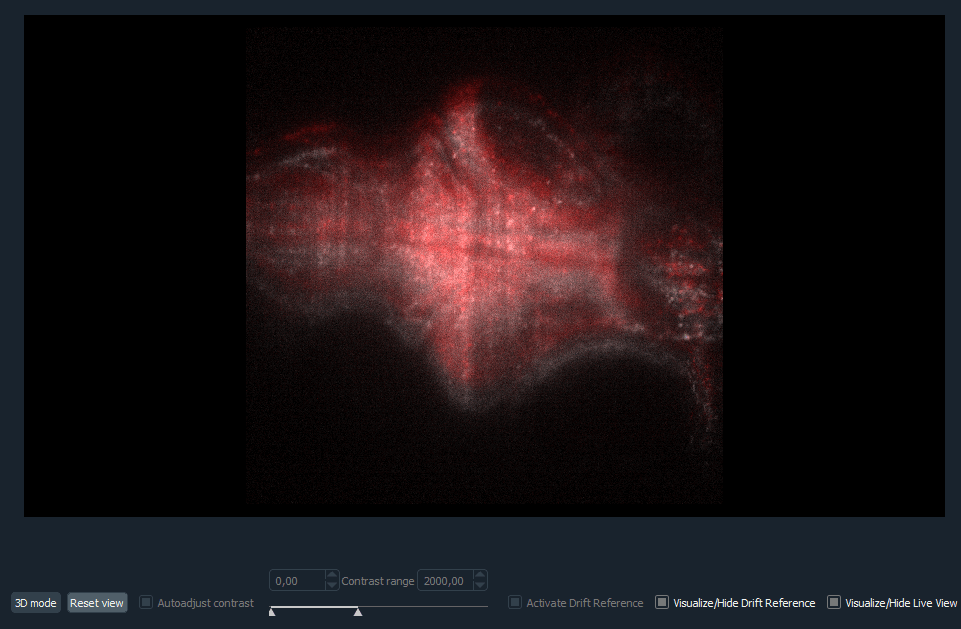
Fig. 6 Example of the drift visualization setting activated. In the figure it can be seen how the red layer is slightly offset compared to the grey live view.#
Mode Panel#
The mode panel (see fig section 4) holds most of the core functionality for the control and setup of the experiment. It is divided into 4 different menus which define different states in which the program is:
Pause: is the home page of the software, in this mode, the viewer is paused and no additional settings are provided.
Calibration: this is the calibration mode, it allows the user to calibrate the relation between piezo and vertical galvos in order to obtain a focused image.
Planar: allows for planar data acquisition, and exploration of the specimen by adjusting the piezo and moving through the z-axis.
Volume: the volumetric mode offers settings for the definition of the vertical scanning range, desired volume rate, and desired planes per volume. Each mode is controlled by its correspondent widget.